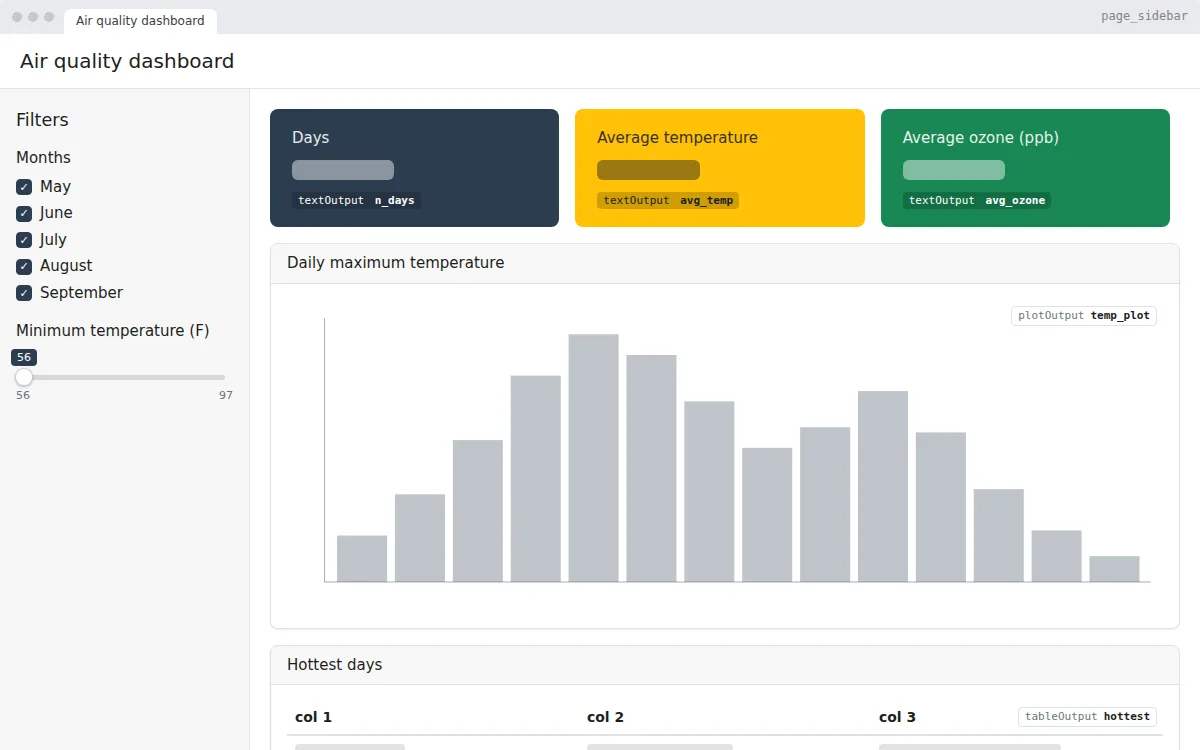
KPI dashboard
A Shiny dashboard with KPI value boxes, sidebar filters, a chart and a top-5 table, built with bslib on R’s airquality data. Free app.R to copy, edit and run.
Upload a CSV file, choose the separator, and see its rows, columns, a searchable table and a summary. Download the data again as CSV. Free Shiny app template.
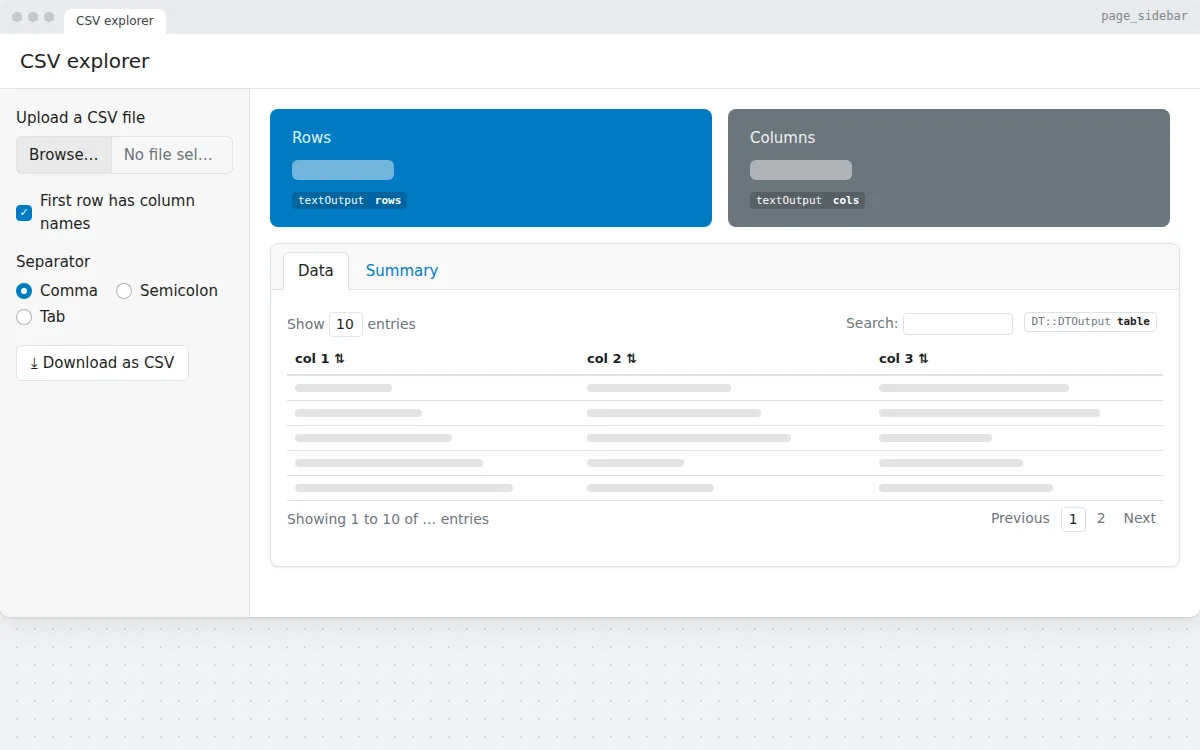
A starting point for any app that works with the user’s own data. Upload a CSV file, tell the app whether the first row holds column names and which separator it uses, and browse the result.
Until a file is uploaded the app shows R’s mtcars data, so there is always something on screen. The same reactive data feeds the value boxes, the table, the summary and the download.
fileInput() for CSV files, read with read.csv()switch() to map choices to valuesDT table and a summary() in tabs# Generated by DropToApp
library(shiny)
library(bslib)
ui <- page_sidebar(
title = "CSV explorer",
sidebar = sidebar(
fileInput("file", "Upload a CSV file", accept = ".csv"),
checkboxInput("header", "First row has column names", value = TRUE),
radioButtons(
"sep",
"Separator",
choices = c("Comma", "Semicolon", "Tab"),
inline = TRUE
),
downloadButton("download", "Download as CSV")
),
layout_columns(
value_box(title = "Rows", value = textOutput("rows"), theme = "primary"),
value_box(
title = "Columns",
value = textOutput("cols"),
theme = "secondary"
)
),
navset_card_tab(
nav_panel("Data", DT::DTOutput("table")),
nav_panel("Summary", verbatimTextOutput("summary"))
)
)
server <- function(input, output, session) {
# Inputs: input$file, input$header, input$sep
# Example data until a file is uploaded
data <- reactive({
if (is.null(input$file)) {
mtcars
} else {
sep <- switch(input$sep, Comma = ",", Semicolon = ";", Tab = "\t")
read.csv(input$file$datapath, header = input$header, sep = sep)
}
})
output$rows <- renderText(nrow(data()))
output$cols <- renderText(ncol(data()))
output$download <- downloadHandler(
filename = "data.csv",
content = function(file) {
write.csv(data(), file, row.names = FALSE)
}
)
output$table <- DT::renderDT({
data()
})
output$summary <- renderPrint({
summary(data())
})
}
shinyApp(ui, server)
app.R, install the packages once with install.packages(c("shiny", "bslib", "DT")), then run shiny::runApp() in the folder with the file.app.R.
A Shiny dashboard with KPI value boxes, sidebar filters, a chart and a top-5 table, built with bslib on R’s airquality data. Free app.R to copy, edit and run.
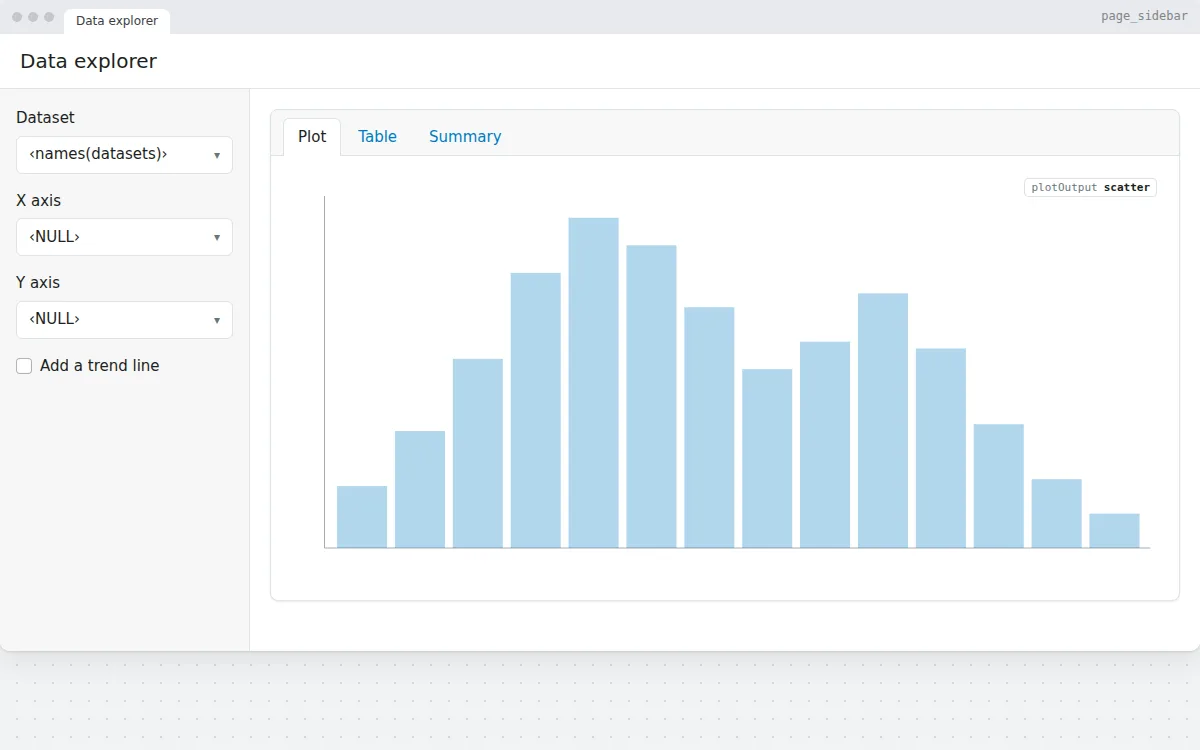
Pick a dataset and two columns to get a scatter plot, a searchable DT table and a summary, with axis choices that update per dataset. Free R Shiny template.
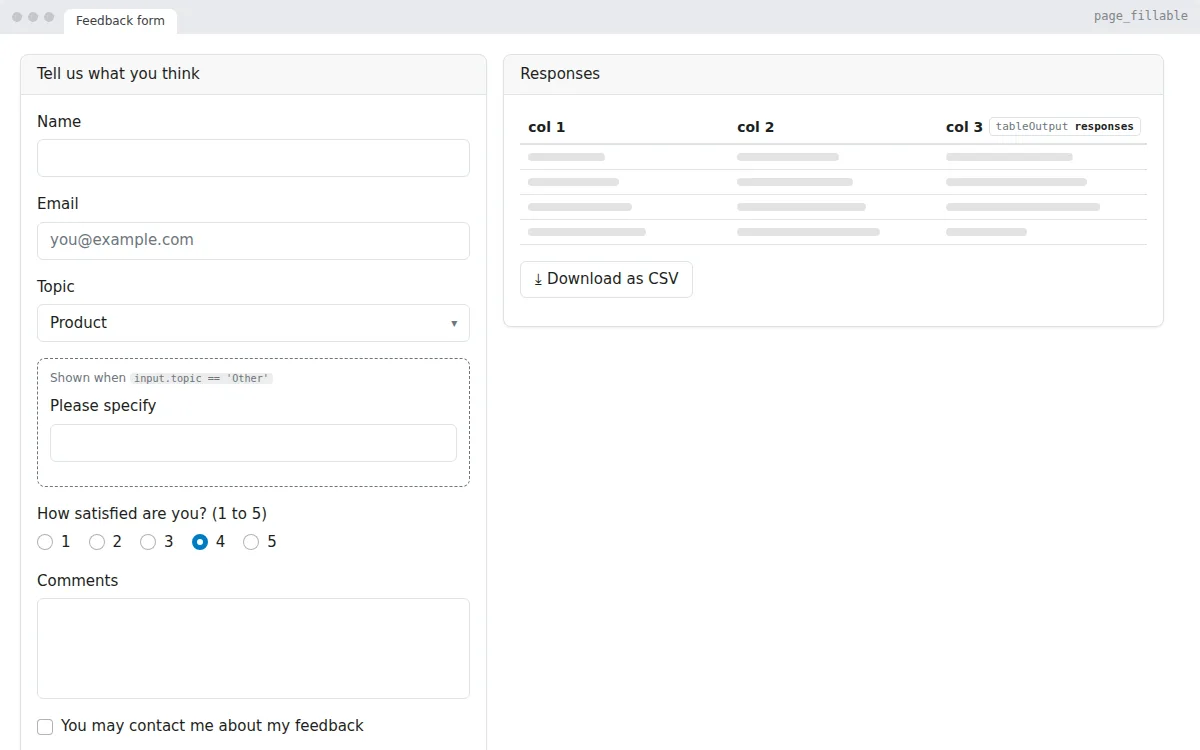
A feedback form in R Shiny: text, choice and rating inputs, a conditional field, validation, a live table of responses and a CSV download. Free app.R.
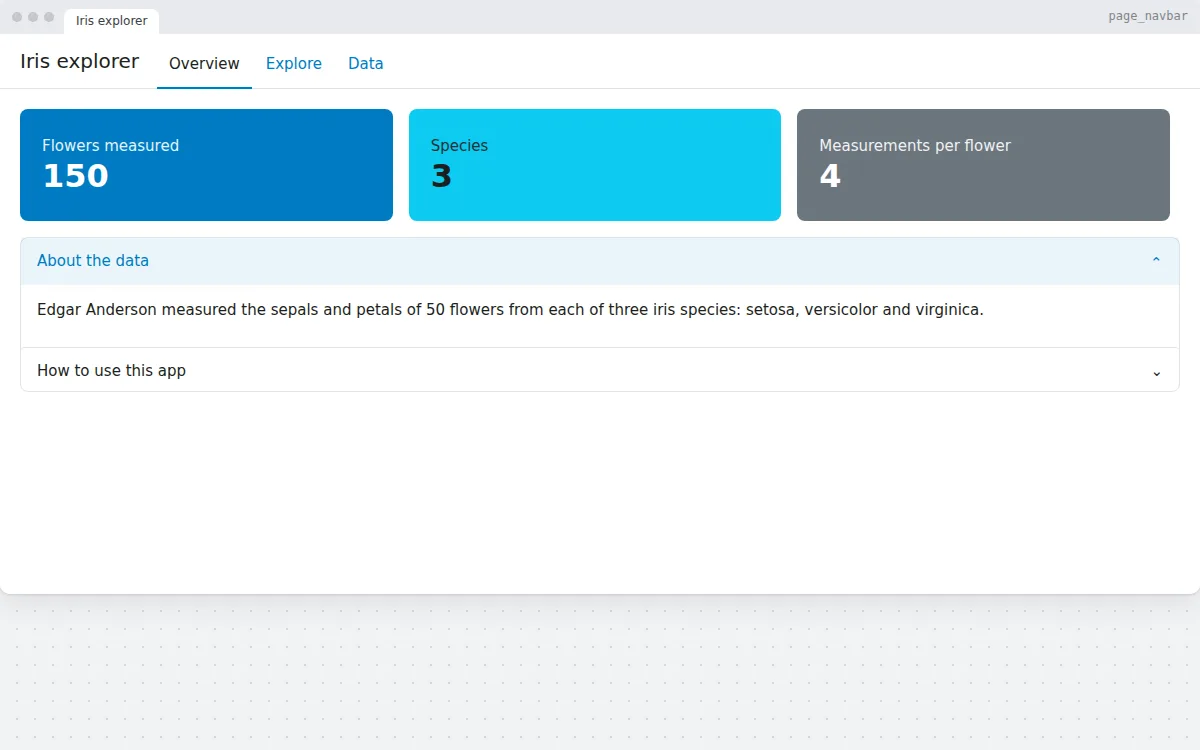
A Shiny app with several pages in a navigation bar: an overview with value boxes and an accordion, an interactive plotly chart and a DT data table.
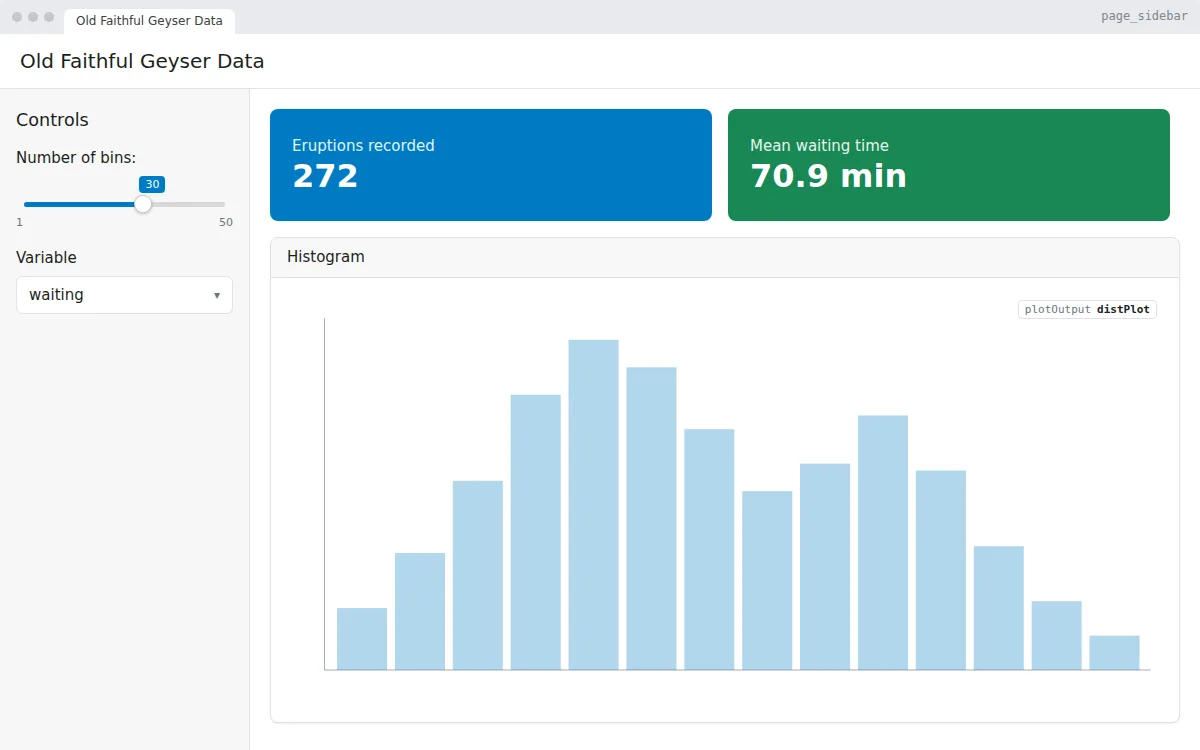
The classic first Shiny app, rebuilt with bslib: a slider and a variable picker drive a histogram of the Old Faithful geyser data. Free app.R to copy and run.