KPI dashboard
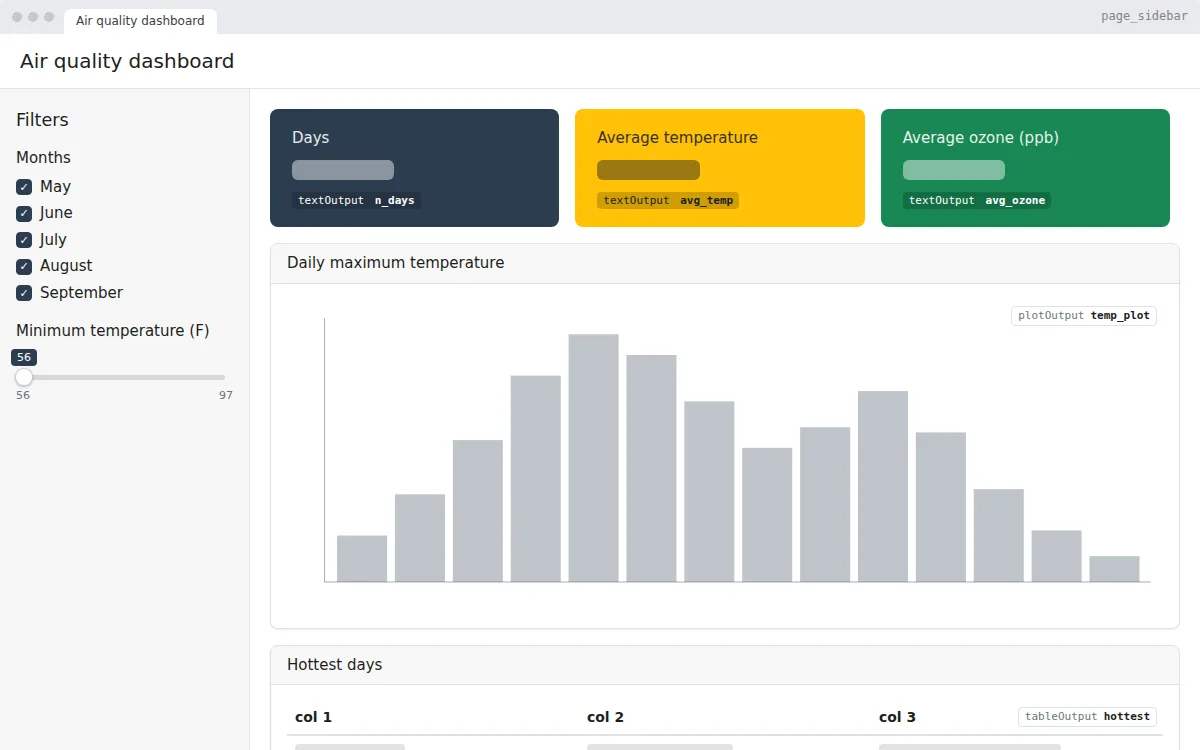
A Shiny dashboard with KPI value boxes, sidebar filters, a chart and a top-5 table, built with bslib on R’s airquality data. Free app.R to copy, edit and run.
A Shiny app with several pages in a navigation bar: an overview with value boxes and an accordion, an interactive plotly chart and a DT data table.
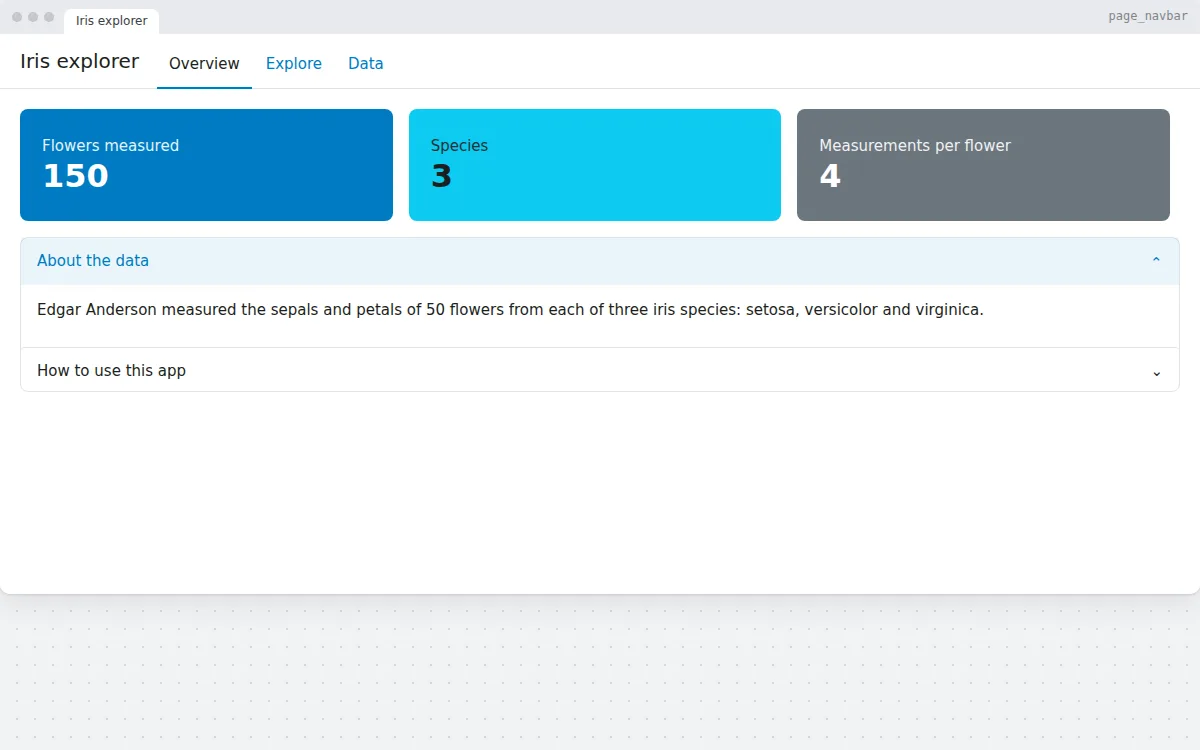
When one page gets crowded, give the app a navigation bar. This template uses bslib’s page_navbar() with three pages: an overview, an explorer with an interactive chart and a data page.
It also shows a few newer bslib components: an accordion for background information and a tooltip that explains a setting when you hover over it. The data is R’s built-in iris dataset.
page_navbar() and nav_panel()accordion() with collapsible sectionsplotly::plotlyOutput() and renderPlotly()tooltip() on a checkboxlayout_columns(col_widths = c(3, 9))# Generated by DropToApp
library(shiny)
library(bslib)
ui <- page_navbar(
title = "Iris explorer",
nav_panel(
"Overview",
layout_columns(
value_box(title = "Flowers measured", value = "150", theme = "primary"),
value_box(title = "Species", value = "3", theme = "info"),
value_box(
title = "Measurements per flower",
value = "4",
theme = "secondary"
)
),
accordion(
accordion_panel(
"About the data",
p(
"Edgar Anderson measured the sepals and petals of 50 flowers from each of three iris species: setosa, versicolor and virginica."
)
),
accordion_panel(
"How to use this app",
p(
"Open Explore to compare two measurements in an interactive chart, or Data to search and sort all 150 flowers."
)
)
)
),
nav_panel(
"Explore",
layout_columns(
col_widths = c(3, 9),
card(
selectInput(
"x",
"X axis",
choices = c("Sepal.Length", "Sepal.Width", "Petal.Length", "Petal.Width"),
selected = "Sepal.Length"
),
selectInput(
"y",
"Y axis",
choices = c("Sepal.Length", "Sepal.Width", "Petal.Length", "Petal.Width"),
selected = "Petal.Length"
),
tooltip(
checkboxInput("by_species", "Colour by species", value = TRUE),
"Give each species its own colour in the chart"
)
),
card(
full_screen = TRUE,
card_header("Interactive chart"),
plotly::plotlyOutput("chart")
)
)
),
nav_panel("Data", DT::DTOutput("table"))
)
server <- function(input, output, session) {
# Inputs: input$x, input$y, input$by_species
output$chart <- plotly::renderPlotly({
x <- iris[[input$x]]
y <- iris[[input$y]]
p <- if (input$by_species) {
plotly::plot_ly(x = x, y = y, color = iris$Species, type = "scatter", mode = "markers")
} else {
plotly::plot_ly(x = x, y = y, type = "scatter", mode = "markers")
}
plotly::layout(p, xaxis = list(title = input$x), yaxis = list(title = input$y))
})
output$table <- DT::renderDT({
iris
})
}
shinyApp(ui, server)
app.R, install the packages once with install.packages(c("shiny", "bslib", "DT", "plotly")), then run shiny::runApp() in the folder with the file.app.R.
A Shiny dashboard with KPI value boxes, sidebar filters, a chart and a top-5 table, built with bslib on R’s airquality data. Free app.R to copy, edit and run.
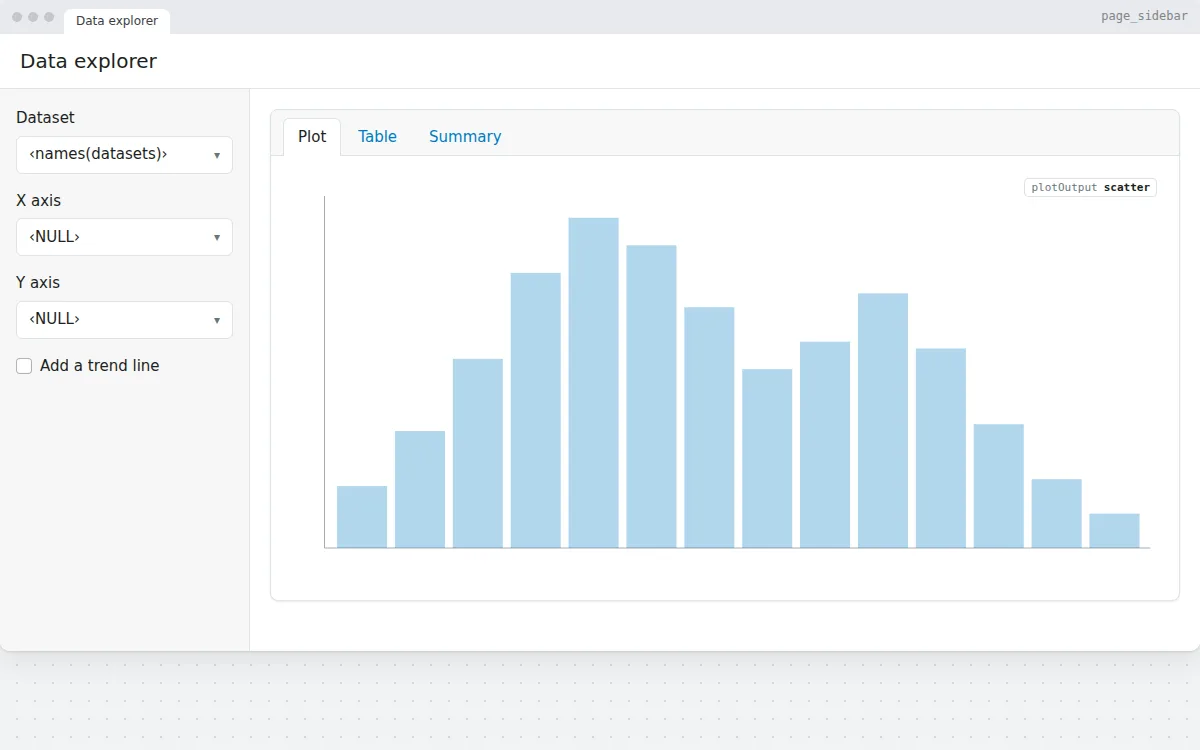
Pick a dataset and two columns to get a scatter plot, a searchable DT table and a summary, with axis choices that update per dataset. Free R Shiny template.
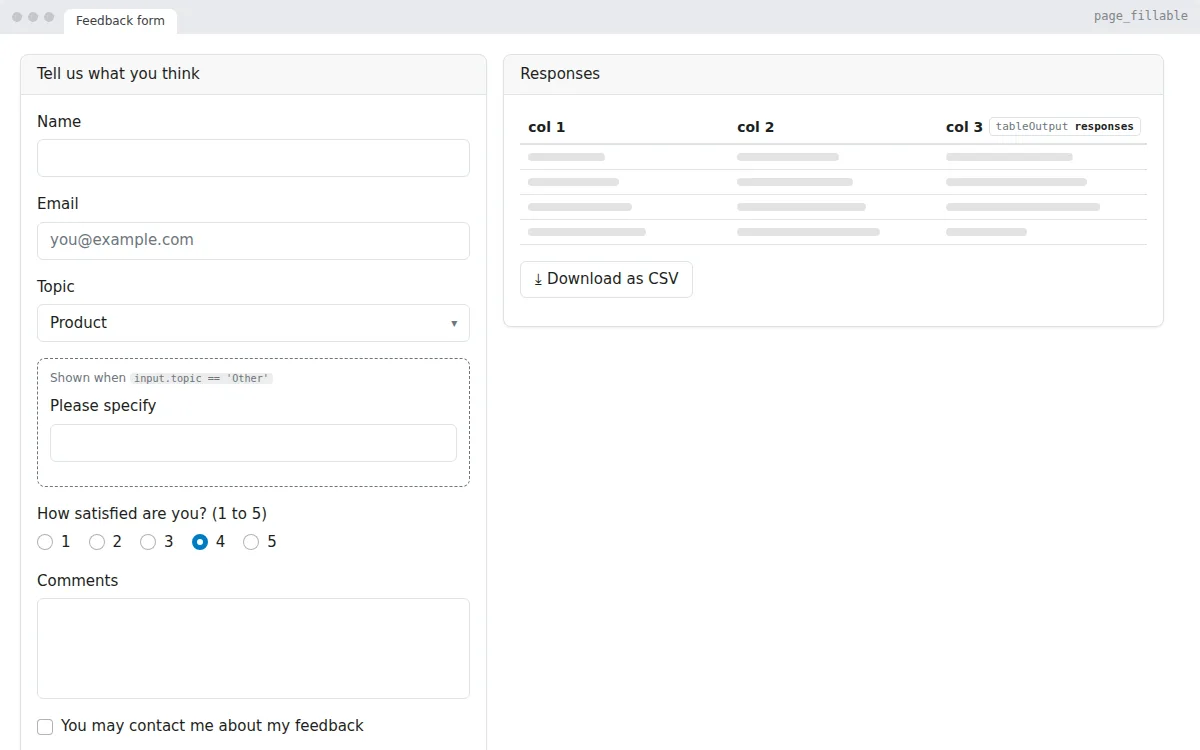
A feedback form in R Shiny: text, choice and rating inputs, a conditional field, validation, a live table of responses and a CSV download. Free app.R.
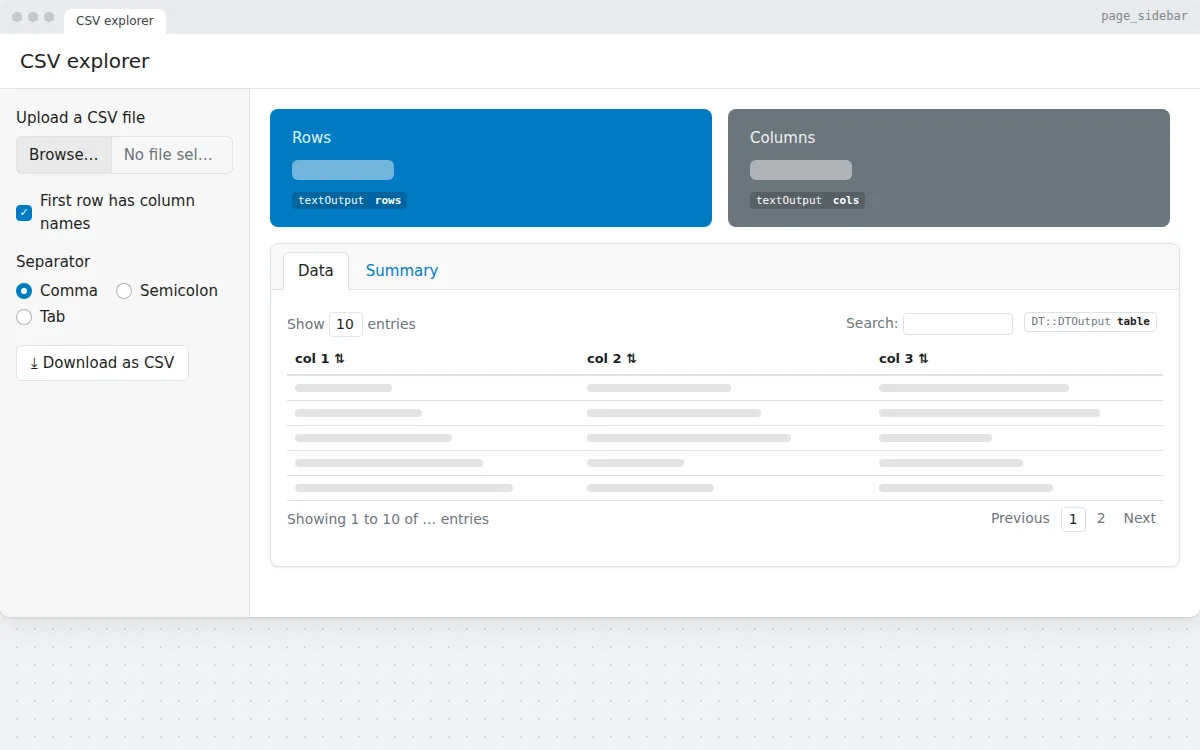
Upload a CSV file, choose the separator, and see its rows, columns, a searchable table and a summary. Download the data again as CSV. Free Shiny app template.
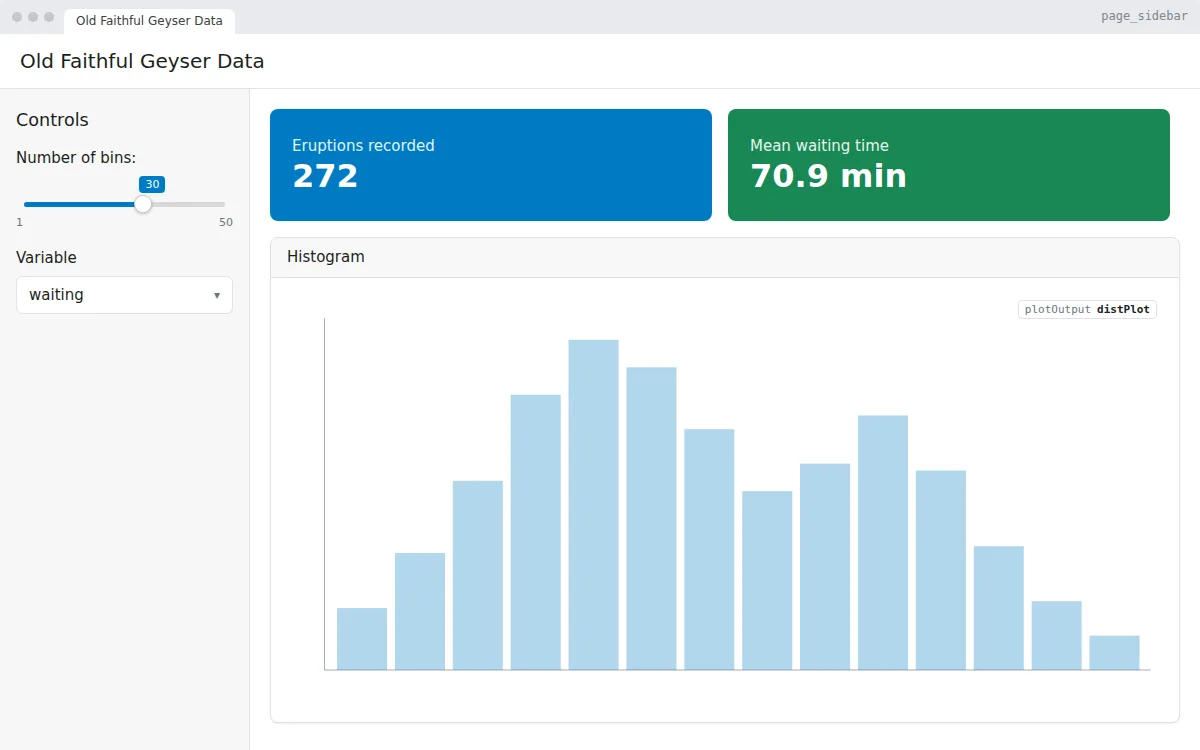
The classic first Shiny app, rebuilt with bslib: a slider and a variable picker drive a histogram of the Old Faithful geyser data. Free app.R to copy and run.