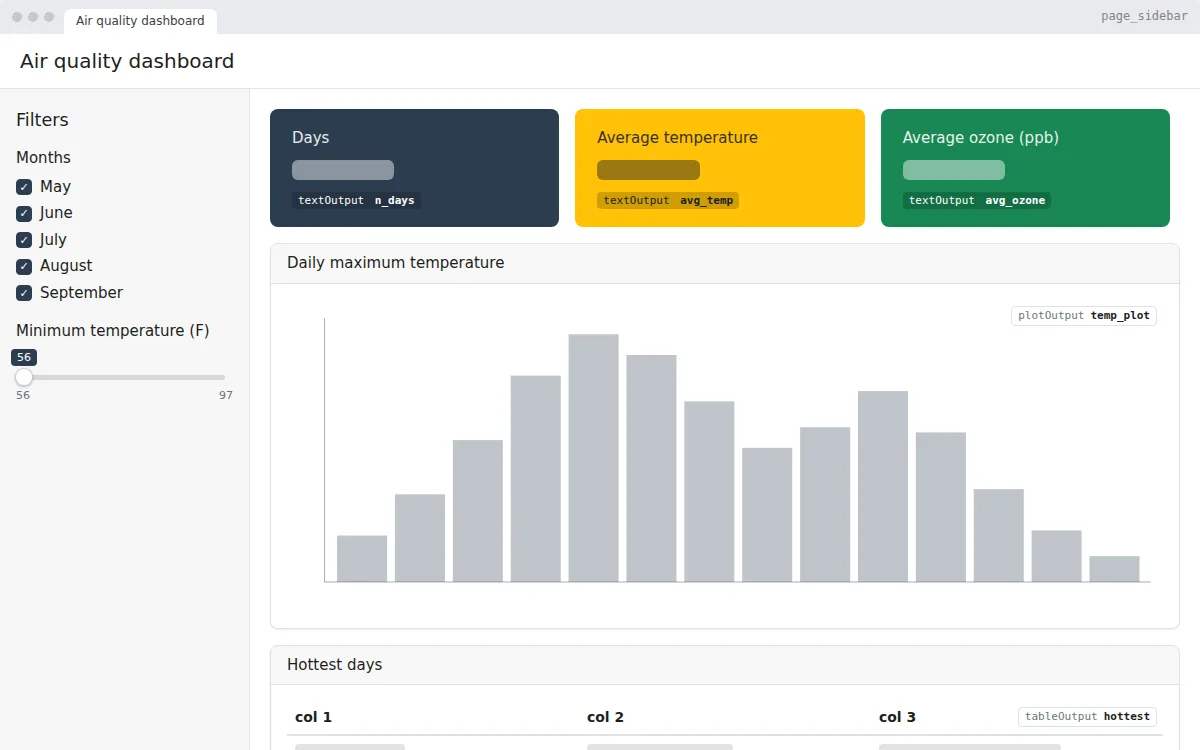
KPI dashboard
A Shiny dashboard with KPI value boxes, sidebar filters, a chart and a top-5 table, built with bslib on R’s airquality data. Free app.R to copy, edit and run.
Pick a dataset and two columns to get a scatter plot, a searchable DT table and a summary, with axis choices that update per dataset. Free R Shiny template.
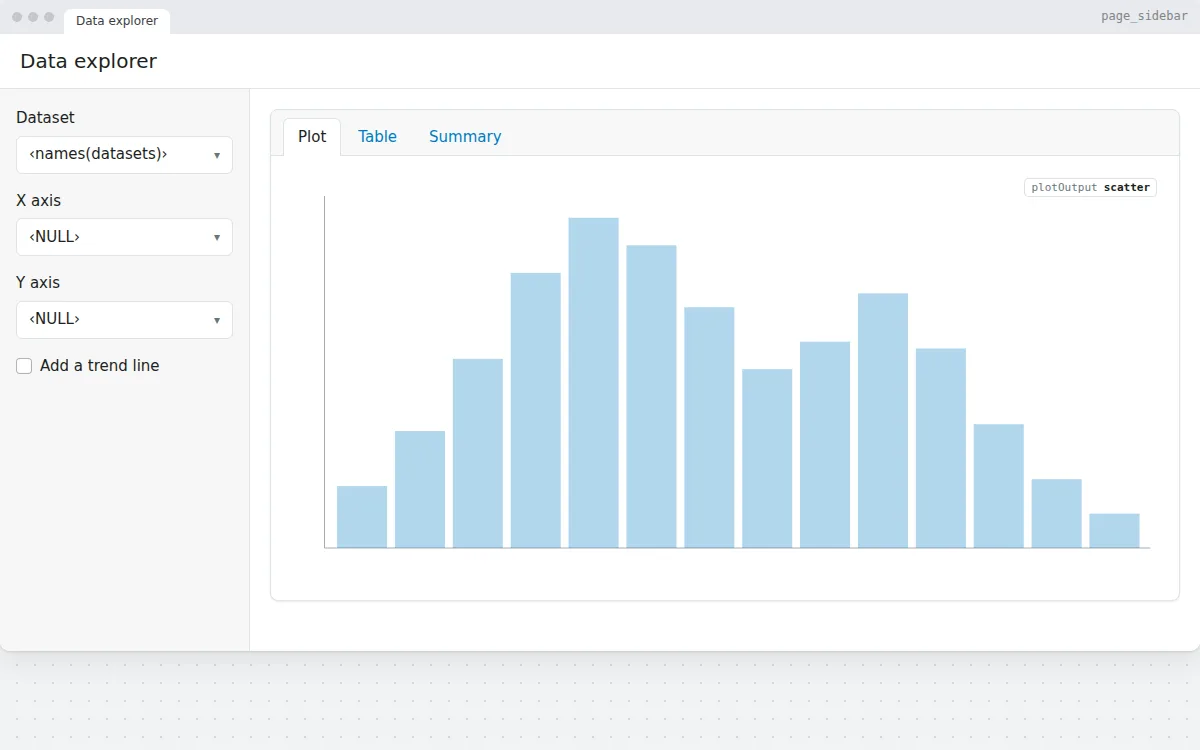
A small exploratory data analysis tool. Choose one of R’s built-in datasets, pick the columns for the X and Y axes, and switch between a scatter plot, an interactive table and a summary in tabs.
The axis menus are filled from the server with updateSelectInput(), so they always list the numeric columns of the chosen dataset. Add your own data frames to the list in the setup code.
observe() and updateSelectInput()navset_card_tab()) with plot, table and summary tabsDT::DTOutput()lm(), switched with a checkboxreq() to wait until the inputs are valid# Generated by DropToApp
library(shiny)
library(bslib)
# Datasets that come with R
datasets <- list(
"Cars (mtcars)" = mtcars,
"Flowers (iris)" = iris,
"Earthquakes (quakes)" = quakes,
"Air quality (airquality)" = airquality
)
ui <- page_sidebar(
title = "Data explorer",
sidebar = sidebar(
selectInput("dataset", "Dataset", choices = names(datasets)),
selectInput("x", "X axis", choices = NULL),
selectInput("y", "Y axis", choices = NULL),
checkboxInput("trend", "Add a trend line")
),
navset_card_tab(
nav_panel("Plot", plotOutput("scatter")),
nav_panel("Table", DT::DTOutput("table")),
nav_panel("Summary", verbatimTextOutput("summary"))
)
)
server <- function(input, output, session) {
# Inputs: input$dataset, input$x, input$y, input$trend
data <- reactive(datasets[[input$dataset]])
# Offer the numeric columns of the chosen dataset as axes
observe({
numeric_cols <- names(Filter(is.numeric, data()))
updateSelectInput(session, "x", choices = numeric_cols, selected = numeric_cols[1])
updateSelectInput(session, "y", choices = numeric_cols, selected = numeric_cols[2])
})
output$scatter <- renderPlot({
d <- data()
req(input$x %in% names(d), input$y %in% names(d))
plot(d[[input$x]], d[[input$y]], xlab = input$x, ylab = input$y,
pch = 19, col = "#007bc288")
if (input$trend) abline(lm(d[[input$y]] ~ d[[input$x]]), col = "#e74c3c", lwd = 2)
})
output$table <- DT::renderDT({
data()
})
output$summary <- renderPrint({
summary(data())
})
}
shinyApp(ui, server)
app.R, install the packages once with install.packages(c("shiny", "bslib", "DT")), then run shiny::runApp() in the folder with the file.app.R.
A Shiny dashboard with KPI value boxes, sidebar filters, a chart and a top-5 table, built with bslib on R’s airquality data. Free app.R to copy, edit and run.
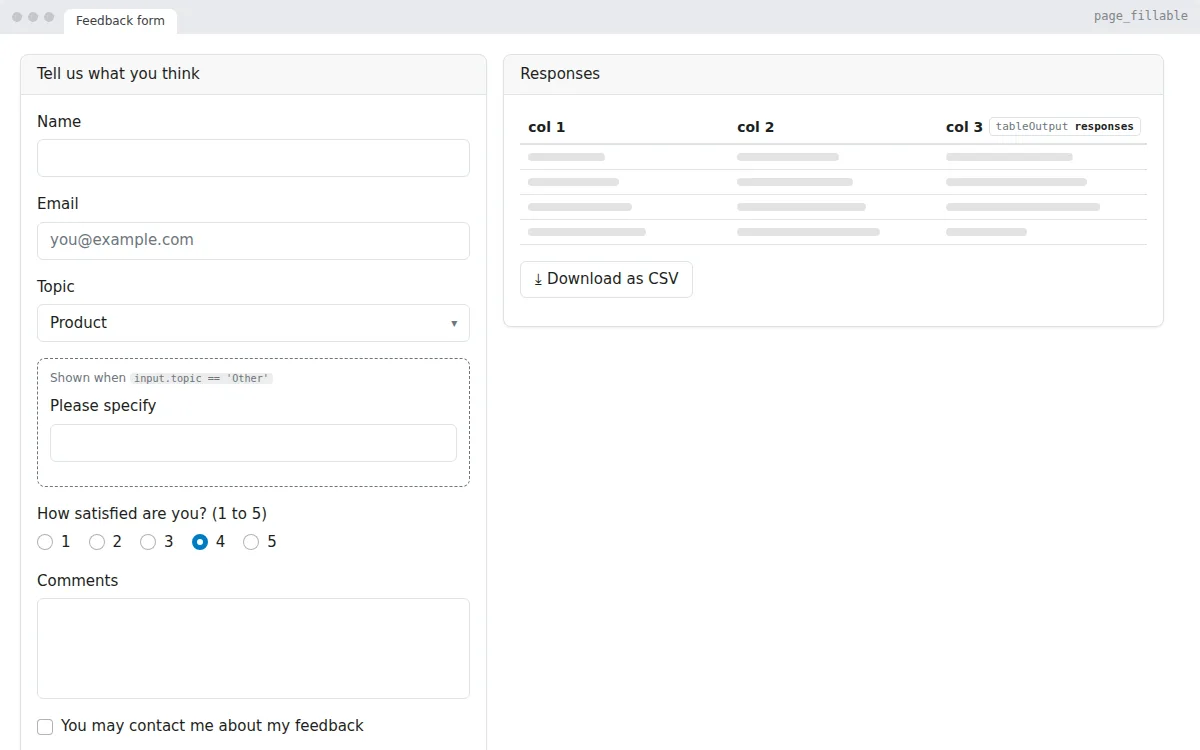
A feedback form in R Shiny: text, choice and rating inputs, a conditional field, validation, a live table of responses and a CSV download. Free app.R.
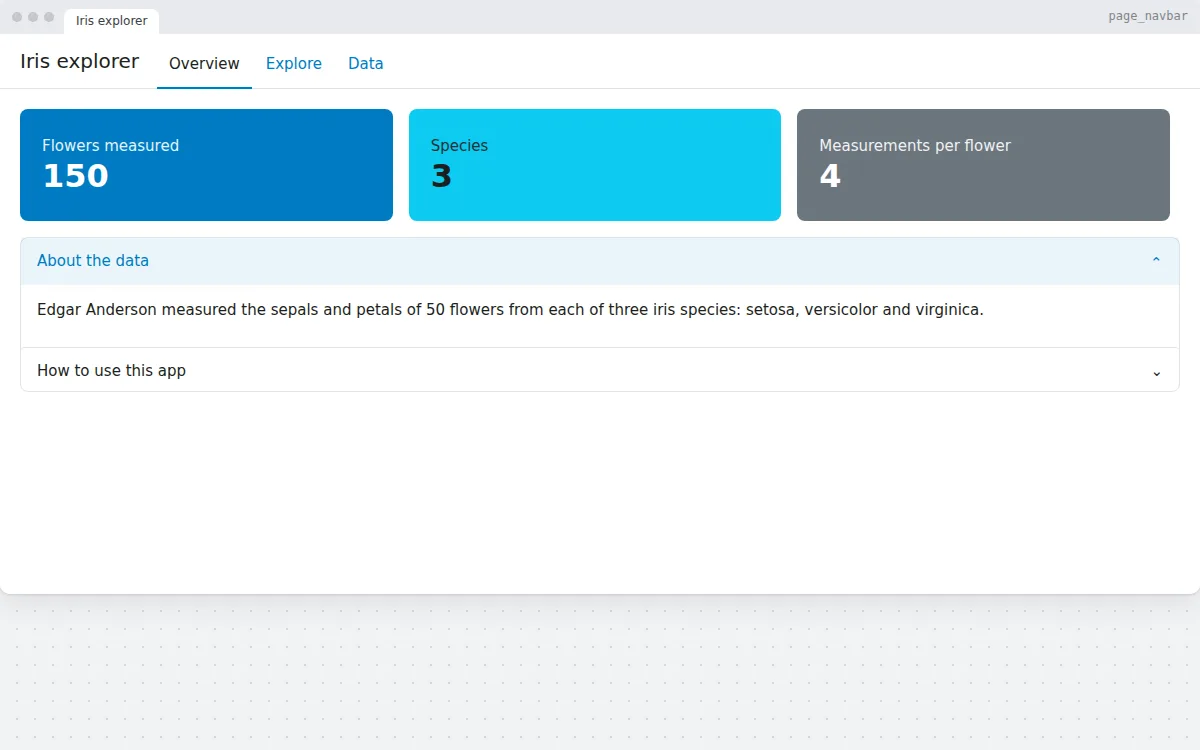
A Shiny app with several pages in a navigation bar: an overview with value boxes and an accordion, an interactive plotly chart and a DT data table.
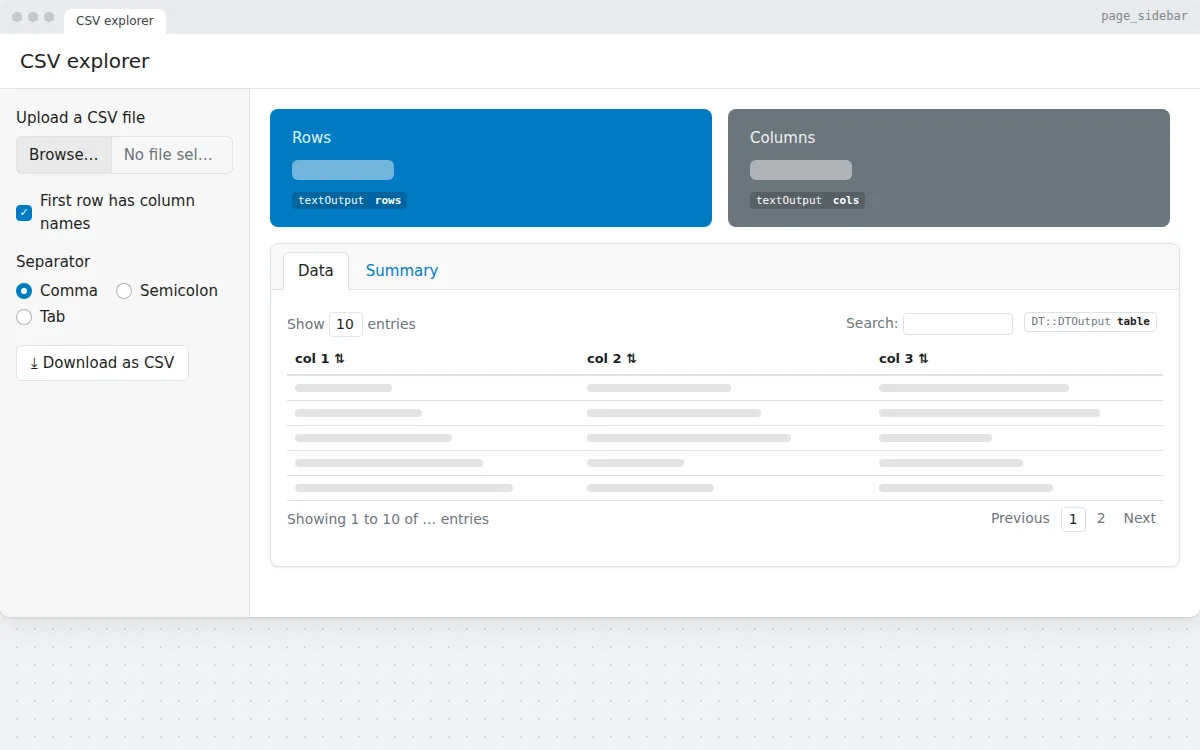
Upload a CSV file, choose the separator, and see its rows, columns, a searchable table and a summary. Download the data again as CSV. Free Shiny app template.
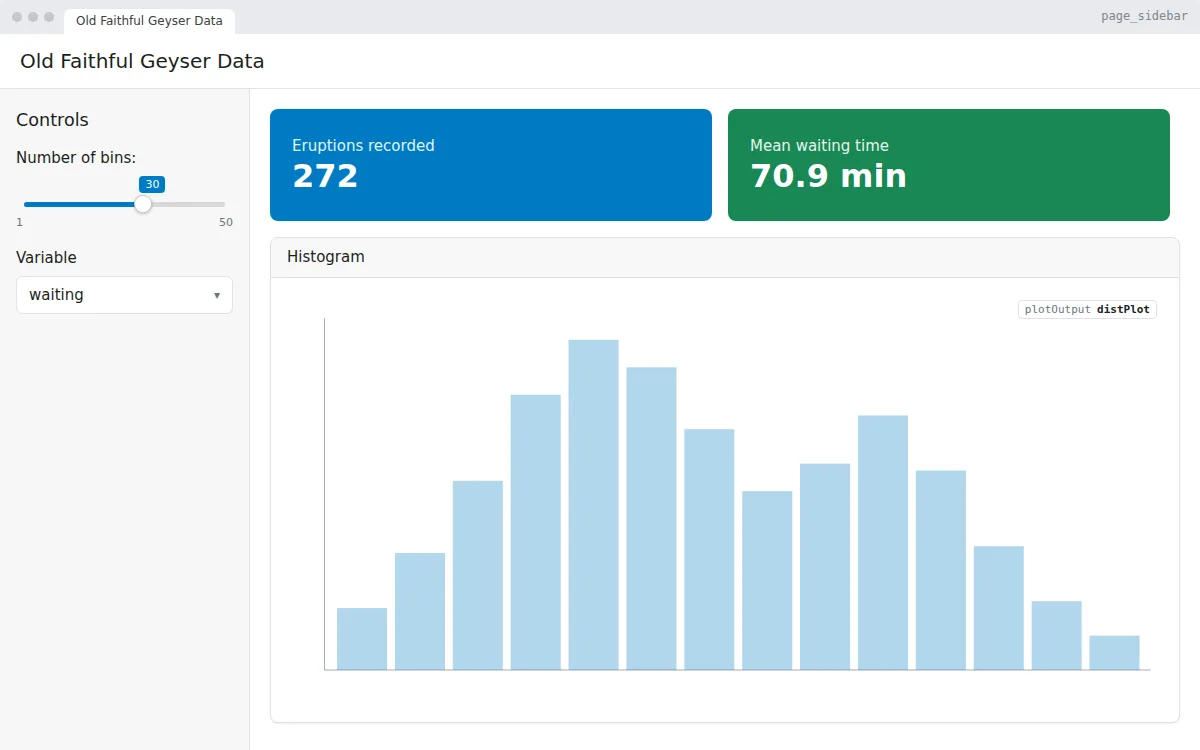
The classic first Shiny app, rebuilt with bslib: a slider and a variable picker drive a histogram of the Old Faithful geyser data. Free app.R to copy and run.