Data explorer
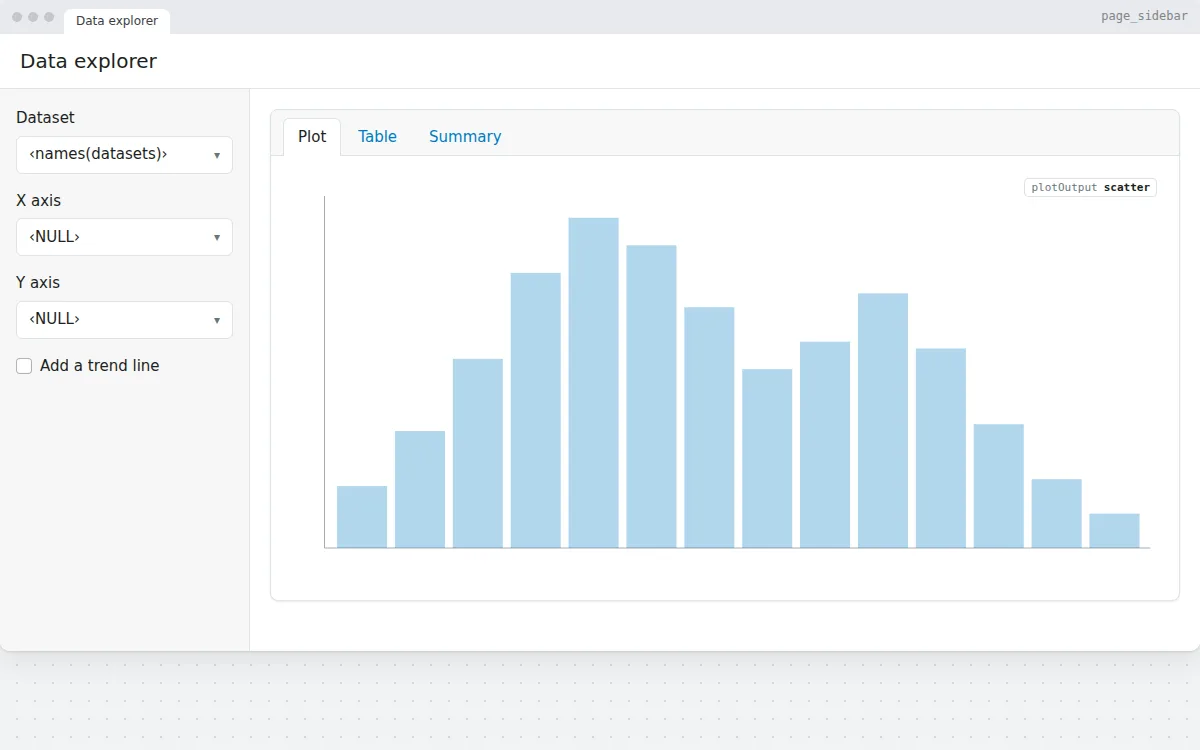
Pick a dataset and two columns to get a scatter plot, a searchable DT table and a summary, with axis choices that update per dataset. Free R Shiny template.
A Shiny dashboard with KPI value boxes, sidebar filters, a chart and a top-5 table, built with bslib on R’s airquality data. Free app.R to copy, edit and run.
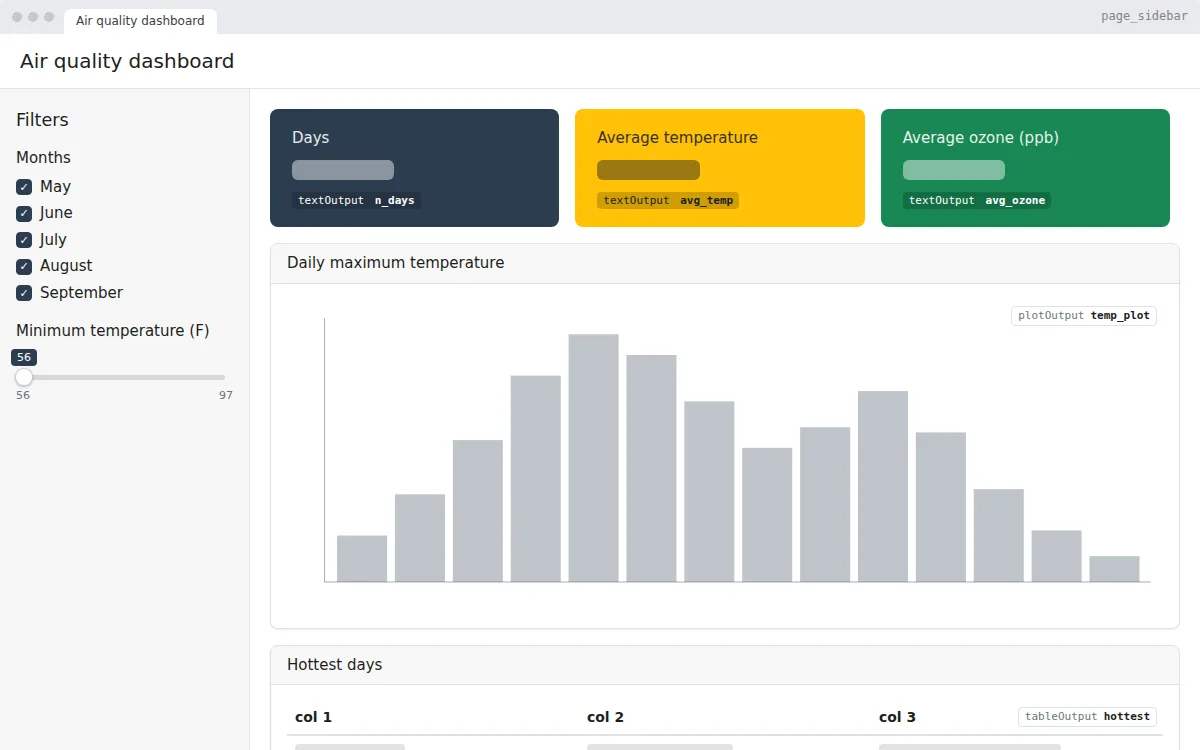
A classic dashboard layout: filters in a sidebar, three key numbers in value boxes across the top, and a chart and a table underneath. It uses the airquality dataset that comes with R (daily measurements in New York, May to September 1973), so it runs as is.
Every number updates as you change the filters. Swap in your own data in the setup code and the reactive filter in the server, and the layout keeps working.
textOutput()reactive() that filters the data once, shared by every outputbs_theme()# Generated by DropToApp
library(shiny)
library(bslib)
# Daily air quality in New York, May to September 1973 (built into R)
aq <- airquality
aq$Date <- as.Date(paste(1973, aq$Month, aq$Day, sep = "-"))
# Average of x, rounded, or "-" when there is nothing to average
avg <- function(x, unit = "") {
if (length(x) == 0 || all(is.na(x))) return("-")
paste0(round(mean(x, na.rm = TRUE), 1), unit)
}
ui <- page_sidebar(
title = "Air quality dashboard",
sidebar = sidebar(
title = "Filters",
checkboxGroupInput(
"months",
"Months",
choices = c("May", "June", "July", "August", "September"),
selected = c("May", "June", "July", "August", "September")
),
sliderInput(
"min_temp",
"Minimum temperature (F)",
min = 56,
max = 97,
value = 56
)
),
theme = bs_theme(bootswatch = "flatly"),
layout_columns(
value_box(
title = "Days",
value = textOutput("n_days"),
theme = "primary"
),
value_box(
title = "Average temperature",
value = textOutput("avg_temp"),
theme = "warning"
),
value_box(
title = "Average ozone (ppb)",
value = textOutput("avg_ozone"),
theme = "success"
)
),
card(
full_screen = TRUE,
card_header("Daily maximum temperature"),
plotOutput("temp_plot", height = "300px")
),
card(card_header("Hottest days"), tableOutput("hottest"))
)
server <- function(input, output, session) {
# Inputs: input$months, input$min_temp
filtered <- reactive({
keep <- aq$Month %in% match(input$months, month.name) & aq$Temp >= input$min_temp
aq[keep, ]
})
output$n_days <- renderText(nrow(filtered()))
output$avg_temp <- renderText(avg(filtered()$Temp, " F"))
output$avg_ozone <- renderText(avg(filtered()$Ozone))
output$temp_plot <- renderPlot({
d <- filtered()
validate(need(nrow(d) > 0, "No days match the filters."))
plot(d$Date, d$Temp, type = "h", lwd = 3, col = "#2c3e50",
xlab = "", ylab = "Temperature (F)")
})
output$hottest <- renderTable({
d <- filtered()
d <- d[order(-d$Temp), c("Date", "Temp", "Ozone", "Wind")]
d$Date <- format(d$Date, "%d %B")
head(d, 5)
})
}
shinyApp(ui, server)
app.R, install the packages once with install.packages(c("shiny", "bslib")), then run shiny::runApp() in the folder with the file.app.R.
Pick a dataset and two columns to get a scatter plot, a searchable DT table and a summary, with axis choices that update per dataset. Free R Shiny template.
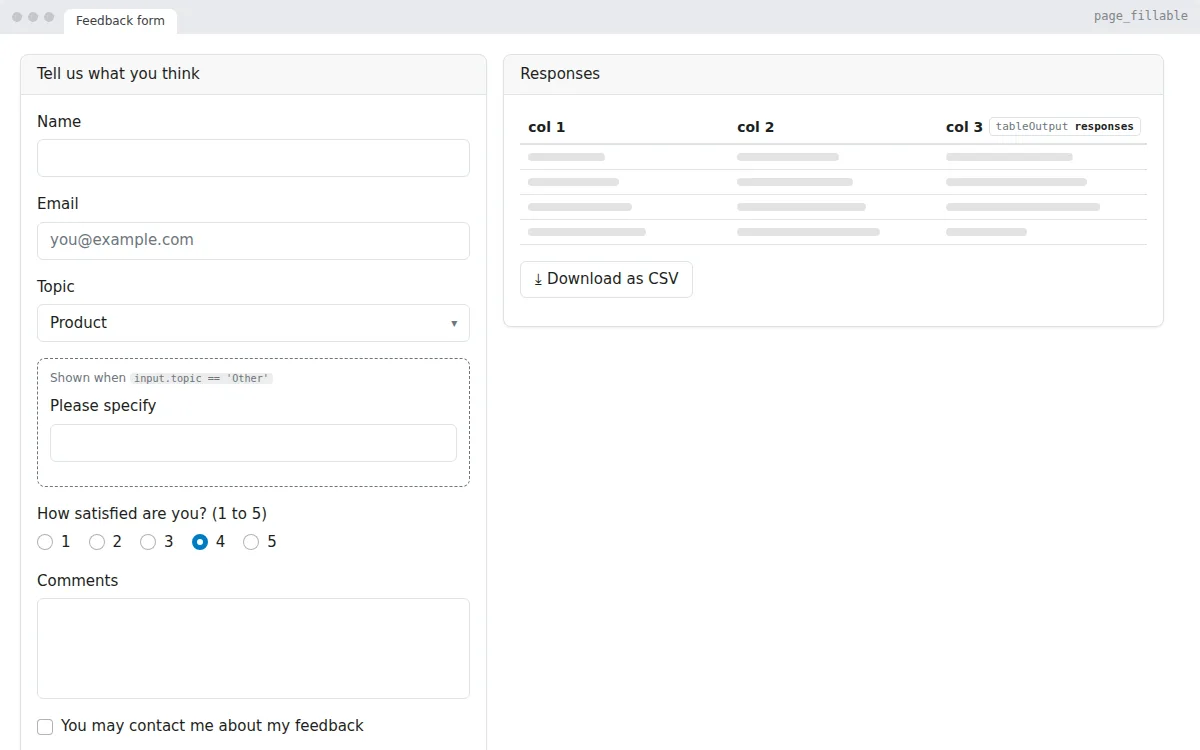
A feedback form in R Shiny: text, choice and rating inputs, a conditional field, validation, a live table of responses and a CSV download. Free app.R.
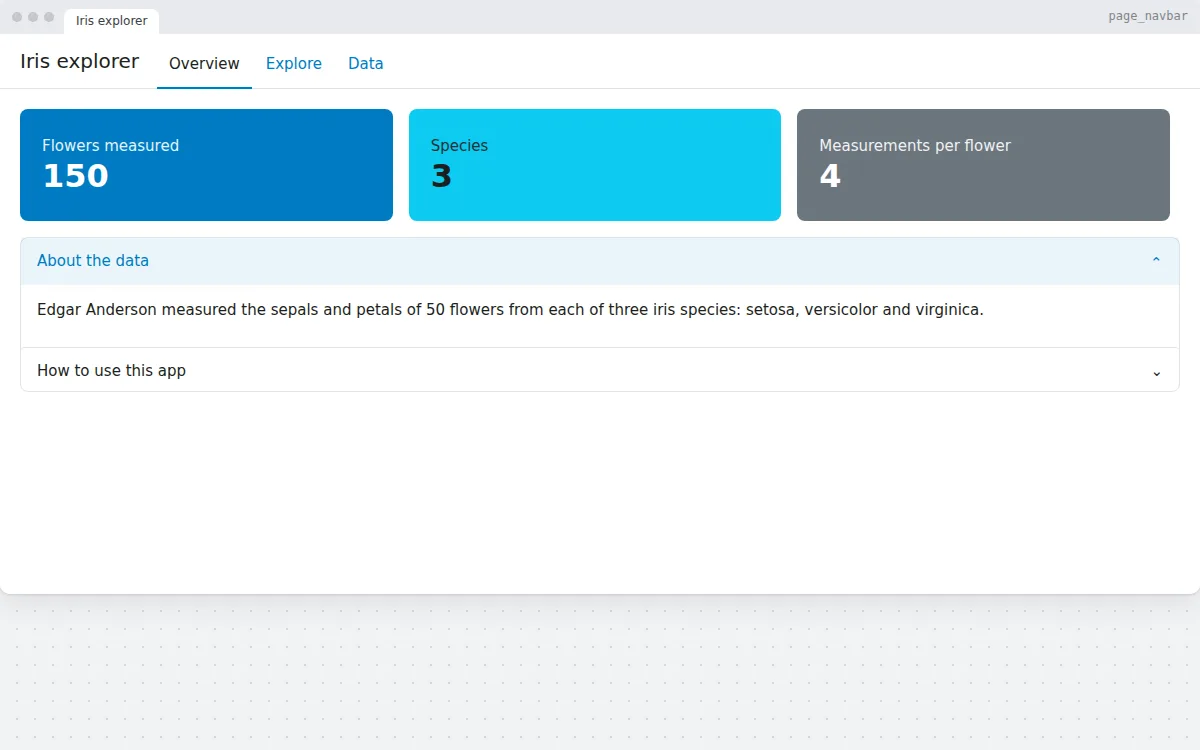
A Shiny app with several pages in a navigation bar: an overview with value boxes and an accordion, an interactive plotly chart and a DT data table.
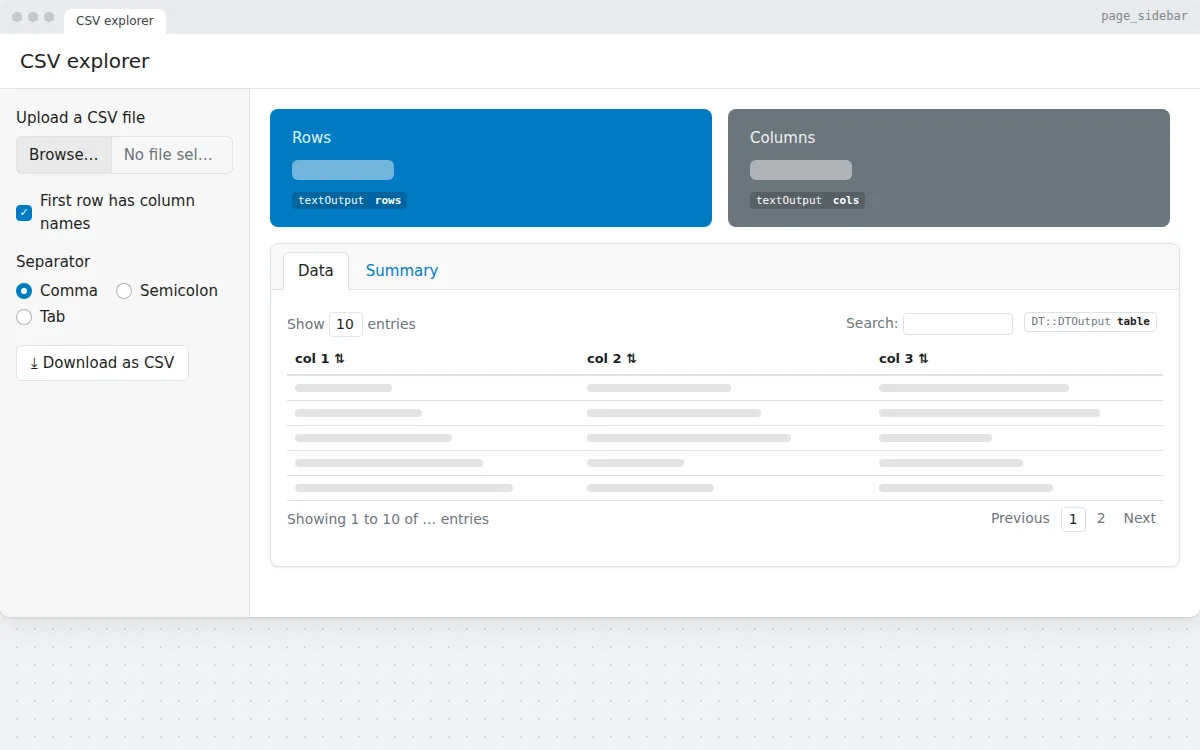
Upload a CSV file, choose the separator, and see its rows, columns, a searchable table and a summary. Download the data again as CSV. Free Shiny app template.
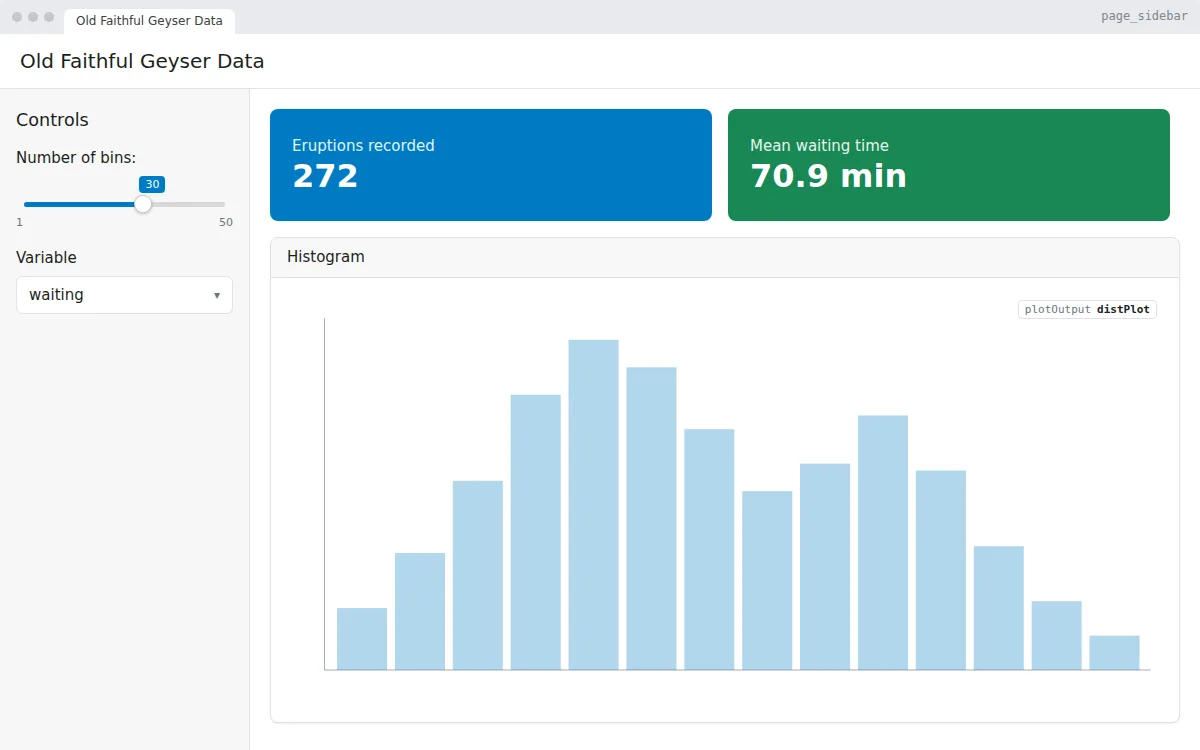
The classic first Shiny app, rebuilt with bslib: a slider and a variable picker drive a histogram of the Old Faithful geyser data. Free app.R to copy and run.