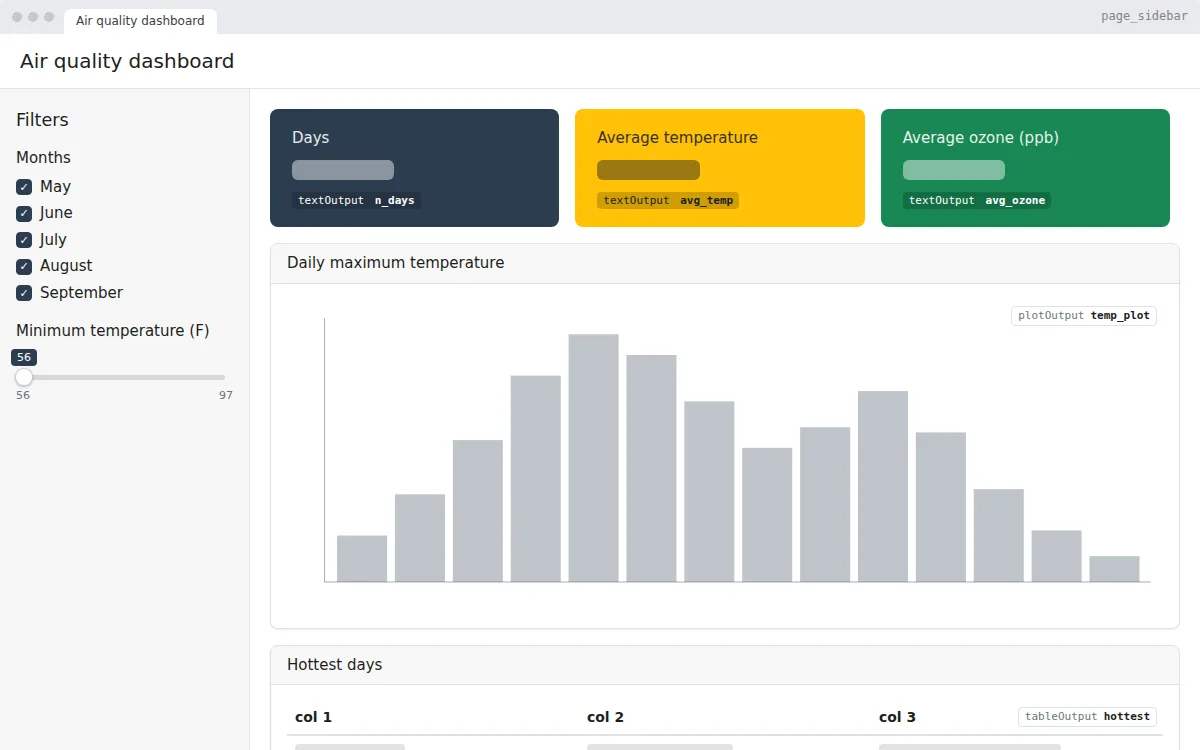
KPI dashboard
A Shiny dashboard with KPI value boxes, sidebar filters, a chart and a top-5 table, built with bslib on R’s airquality data. Free app.R to copy, edit and run.
Complete, working Shiny apps built with bslib, ready to copy. Each one comes with the full app.R, runs in your browser without installing R, and opens in the DropToApp editor so you can change it by drag and drop or in code.
A Shiny dashboard with KPI value boxes, sidebar filters, a chart and a top-5 table, built with bslib on R’s airquality data. Free app.R to copy, edit and run.
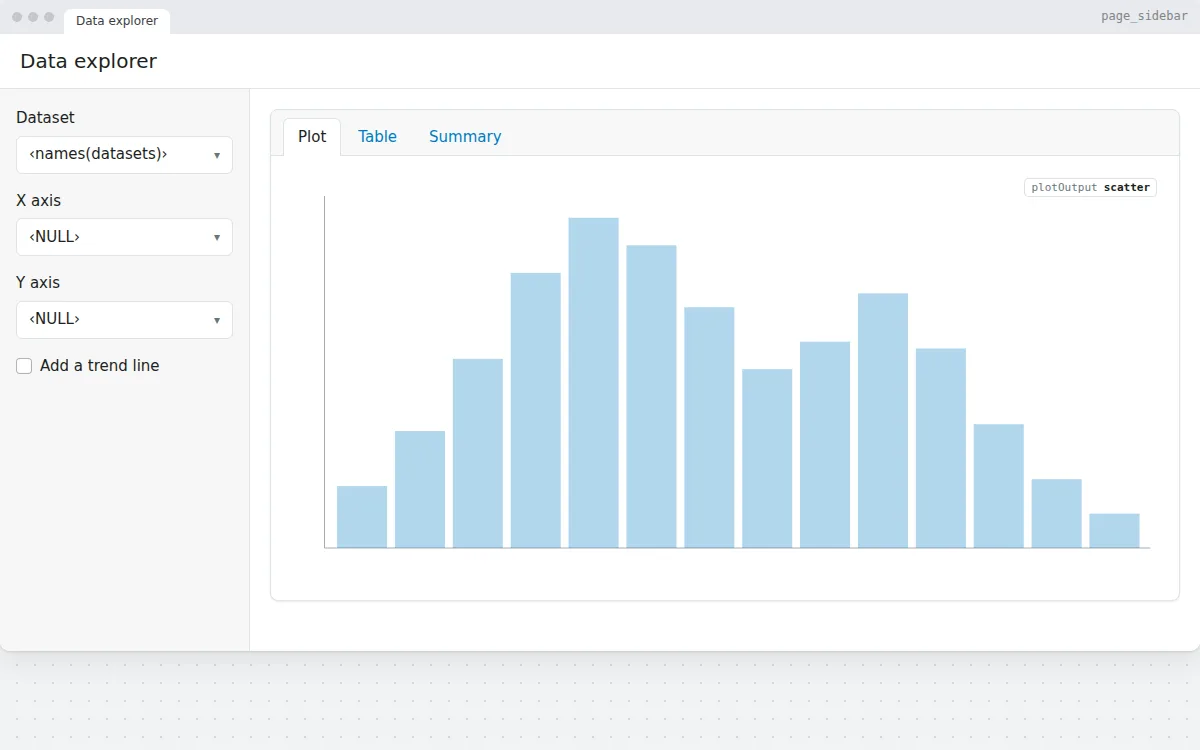
Pick a dataset and two columns to get a scatter plot, a searchable DT table and a summary, with axis choices that update per dataset. Free R Shiny template.
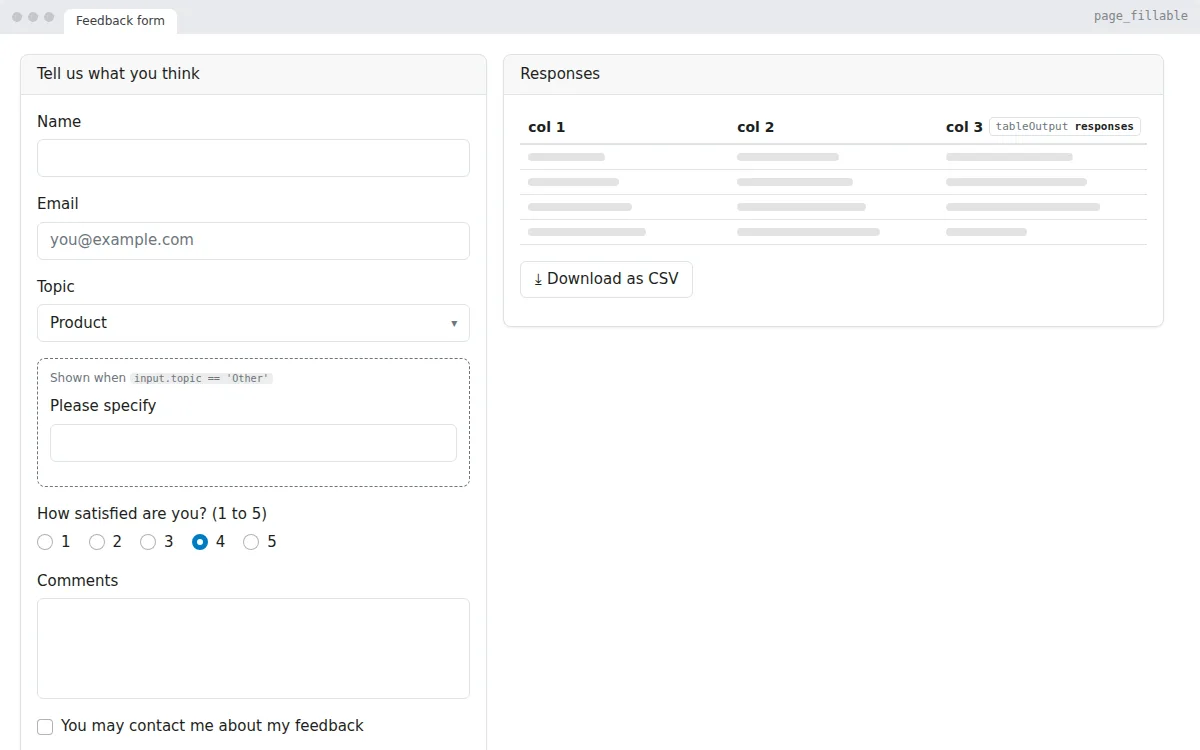
A feedback form in R Shiny: text, choice and rating inputs, a conditional field, validation, a live table of responses and a CSV download. Free app.R.
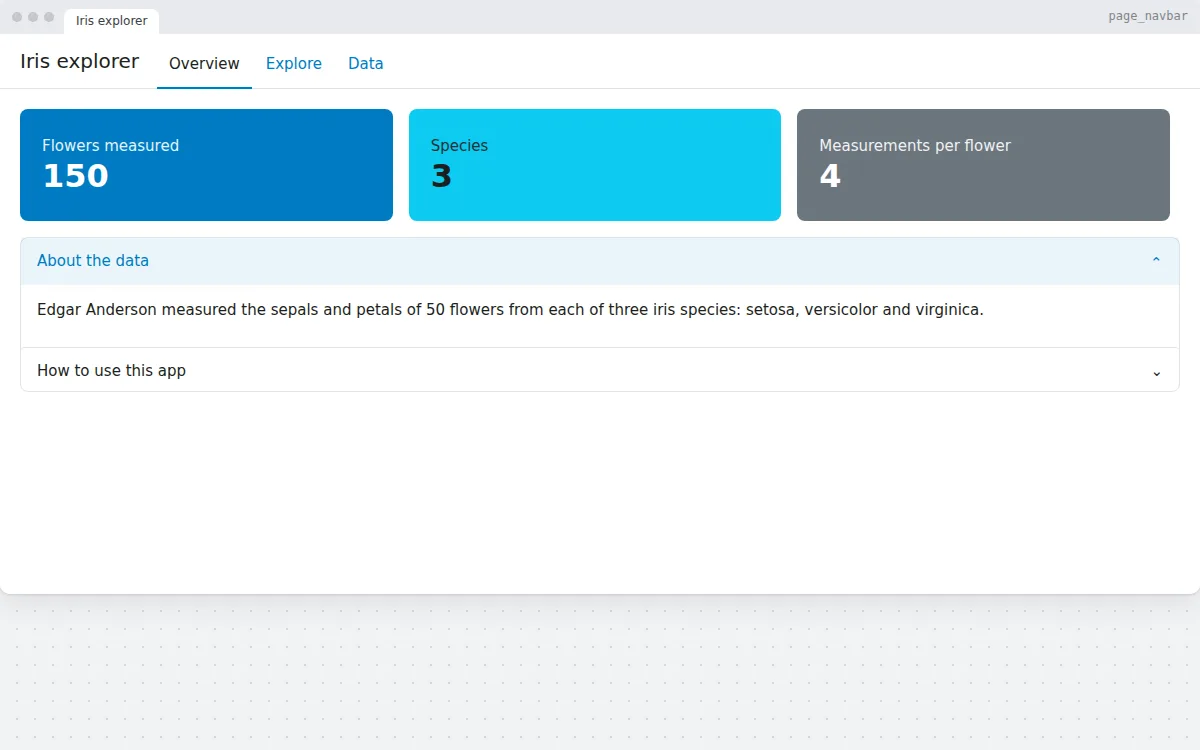
A Shiny app with several pages in a navigation bar: an overview with value boxes and an accordion, an interactive plotly chart and a DT data table.
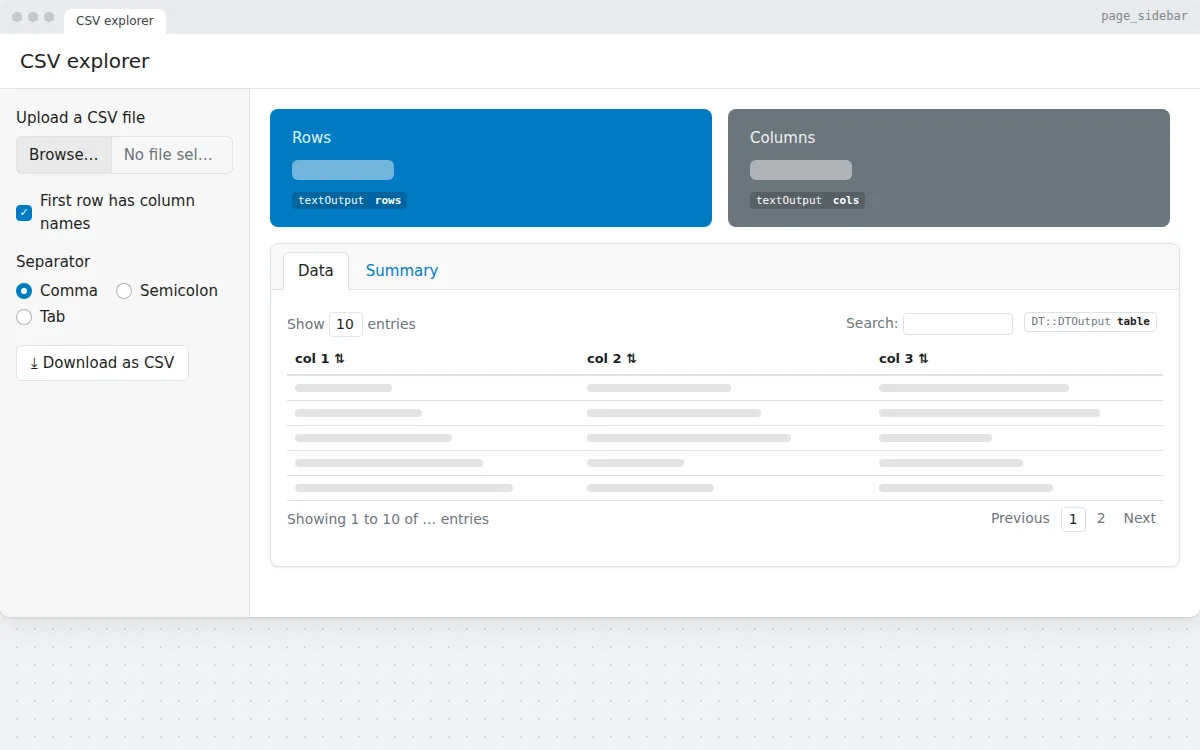
Upload a CSV file, choose the separator, and see its rows, columns, a searchable table and a summary. Download the data again as CSV. Free Shiny app template.
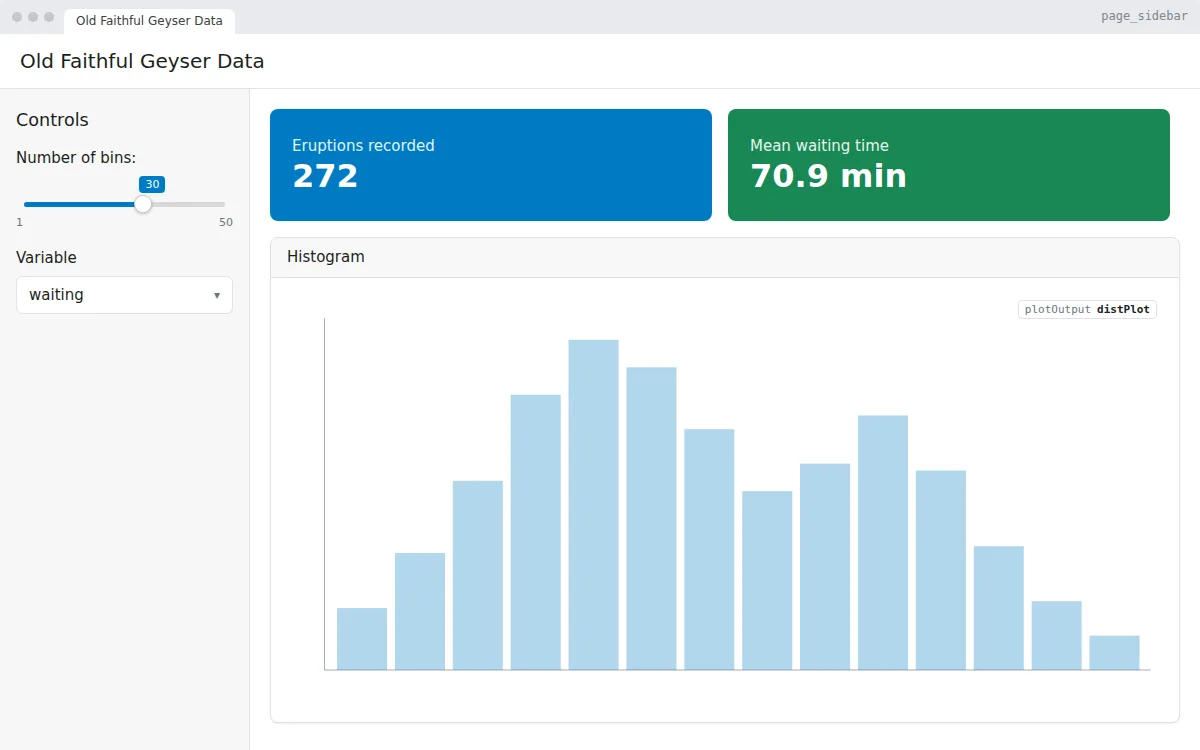
The classic first Shiny app, rebuilt with bslib: a slider and a variable picker drive a histogram of the Old Faithful geyser data. Free app.R to copy and run.
app.R and run it with shiny::runApp(), or deploy it to Shiny Server, Posit Connect or shinyapps.io.